alamarBlue® examples:
Determining optimum cell density and incubation time for A549 and P388 cells
Two useful worked example experiments have been performed using A549 and P388 cells, the methods include optimizing for the appropriate cell density and incubation time for a spectrometry experiments as discussed previously. The results are included in both table and graphical forms so you can compare the data from both cell types.
Example experiment to determine optimum cell density and incubation time for A549 cells, using alamarBlue and spectrophotometry
The cell line A549 is a monolayer culture. The method given was followed to find the percentage reduction of alamarBlue after incubation with A549 cells at different densities and for different incubation periods.
Absorbance values at 570 nm and 600 nm after blanking with media only for A549 cells
|
Time (hrs) |
Absorbance values at 570 nm |
Absorbance values at 600 nm |
||||||||
|
Blue in Media |
500 cells/ml |
1000 cells/ml |
5000 cells/ml |
10000 cells/ml |
Blue in Media |
500 cells/ml |
1000 cells/ml |
5000 cells/ml |
10000 cells/ml |
|
|
0 |
0.336 |
0.336 |
0.338 |
0.348 |
0.372 |
0.441 |
0.439 |
0.443 |
0.459 |
0.496 |
|
2 |
0.334 |
0.339 |
0.352 |
0.432 |
0.54 |
0.44 |
0.425 |
0.421 |
0.349 |
0.267 |
|
4 |
0.333 |
0.346 |
0.365 |
0.489 |
0.59 |
0.432 |
0.411 |
0.397 |
0.265 |
0.162 |
|
5.5 |
0.321 |
0.344 |
0.366 |
0.511 |
0.573 |
0.424 |
0.397 |
0.377 |
0.211 |
0.135 |
|
20 |
0.322 |
0.438 |
0.51 |
0.518 |
0.486 |
0.412 |
0.271 |
0.18 |
0.102 |
0.112 |
Using absorbance data from the sample data set, percent reduction of alamarBlue was calculated using equation 1:
|
Percentage reduction of alamarBlue (equation 1) |
= |
(O2 x A1) - (O1 x A2) (R1 x N2) - (R2 x N1) |
x100 |
|
Percentage reduction of alamarBlue after incubation with A549 cells at different cell densities and incubation periods.
|
Time (hrs) |
Percentage reduction of alamarBlue |
|||
|
500 cells/ml |
1000 cells/ml |
5000 cells/ml |
10000 cells/ml |
|
|
0 |
6.3 |
6.1 |
6 |
5.7 |
|
2 |
8.6 |
11.5 |
35.4 |
65.7 |
|
4 |
11.9 |
17.3 |
57.7 |
89.9 |
|
5.5 |
13.6 |
20.4 |
70 |
91.8 |
|
20 |
49.6 |
76.2 |
88.3 |
80.7 |
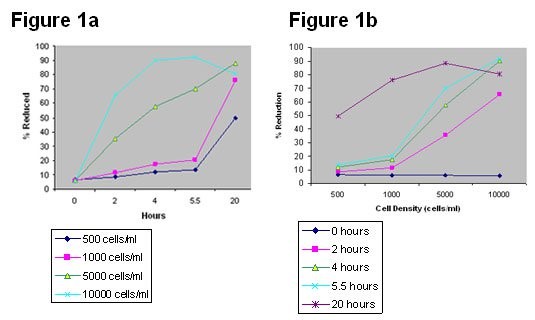
These values are plotted to produce Figures 1a & 1b.

Graphs showing percentage of alamarBlue reduction for A549 cells with different incubation periods (Figure 1a) and at different initial cell densities (Figure 1b).
Using the data from Figure 1b: If, for example, the desired incubation time with alamarBlue were 4 hours, any plating density from 500 to 10,000 cells/ml could be used and expected to produce a reaction within the linear range for alamarBlue for that incubation period with a549 cells. However, if the intent is to incubate for 20 hours, the reaction could only be expected to be within the linear range if plated at 500-1000 cells/ml for this cell line.
Example experiment to determine optimum cell density and incubation time for P388 cells, using alamarBlue and spectrophotometry
The cell line P388 is a suspension cell line. The method was followed to find the percentage reduction of alamarBlue after incubation with P388 cells at different densities and for different incubation periods.
|
Time (hrs) |
Absorbance values at 570 nm |
Absorbance values at 600 nm |
||||||||
|
Blue in Media |
500 cells/ml |
1000 cells/ml |
5000 cells/ml |
10000 cells/ml |
Blue in Media |
500 cells/ml |
1000 cells/ml |
5000 cells/ml |
10000 cells/ml |
|
|
0 |
0.336 |
0.342 |
0.334 |
0.332 |
0.328 |
0.441 |
0.451 |
0.438 |
0.433 |
0.422 |
|
2 |
0.334 |
0.34 |
0.333 |
0.335 |
0.335 |
0.44 |
0.448 |
0.435 |
0.422 |
0.404 |
|
4 |
0.333 |
0.339 |
0.332 |
0.339 |
0.346 |
0.432 |
0.444 |
0.432 |
0.414 |
0.391 |
|
5.5 |
0.321 |
0.331 |
0.325 |
0.335 |
0.344 |
0.424 |
0.435 |
0.424 |
0.404 |
0.377 |
|
20 |
0.322 |
0.332 |
0.328 |
0.481 |
0.434 |
0.412 |
0.423 |
0.415 |
0.337 |
0.253 |
Using absorbance data from the sample data set, percent reduction of alamarBlue was calculated using equation 1:
|
Percentage reduction of alamarBlue (equation 1) |
= |
(O2 x A1) - (O1 x A2) (R1 x N2) - (R2 x N1) |
x100 |
||||
|
|
|||||||
Percentage reduction of alamarBlue for P388 cells at a range of cell densities following different incubation periods:
|
Time (hrs) |
Percentage reduction of alamarBlue |
|||
|
500 cells/ml |
1000 cells/ml |
5000 cells/ml |
10000 cells/ml |
|
|
0 |
5.9 |
6 |
6.3 |
7 |
|
2 |
5.9 |
6.3 |
8.3 |
10.6 |
|
4 |
6.3 |
6.6 |
10.2 |
14.5 |
|
5.5 |
6.1 |
6.4 |
10.9 |
16.2 |
|
20 |
8.1 |
8.4 |
29.5 |
51.3 |
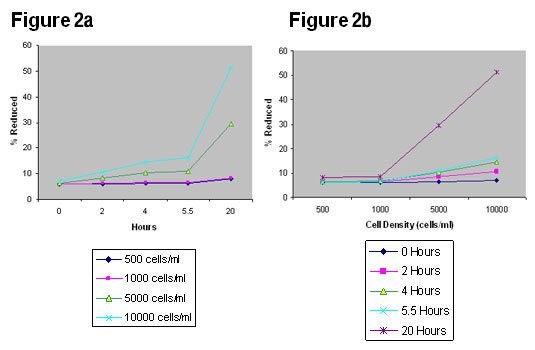
These values are plotted to produce Figures 2a & 2b.

Graphs showing percentage of alamarBlue reduction for P388 cells with different incubation periods (Figure 2a) and at different initial cell densities (Figure 2b).
For p388, even with
an initial plating density up to 10,000 cells per well, data is within range
and alamarBlue has only been reduced by 50% after 20 hours. This indicates
cells should be incubated with alamarBlue for up to 2 days, even when
plated at this high density. If a shortened exposure is desired, then the
initial plating density should be increased. If the goal is to continue the experiment
for more than 2 days, then the initial plating density should be decreased.
Similar information is gained from examination of Figures 2a & b![]()
With high cell numbers or extended incubation time (days), a point will be reached where the red form stops increasing and begins to decline. The absorbance/fluorescence level drops with a corresponding clearing of the red color. This is demonstrated in Figure 1a, when a549 cells are plated at 10,000 cells/ml and incubated for more than 4 hours. Refer to Frequently Asked Question 7for further information about extended incubation times.
訂購信息:原料來自(zì)專利持有生(shēng)廠商,高(gāo)品質産品,現貨供應,質量保證,全球已有大量的忠實粉,歡迎來電(diàn)咨詢,021-54736159,QQ:2971634497。
|
産品名稱 |
産品編号 |
規格 |
價格(元) |
貨期 |
|
5ml (500T) |
295 |
現貨 |
||
|
10ml (1000T) |
550 |
現貨 |
||
|
MX3006-50ML |
50ml (5000T) |
1925 |
現貨 |